solar is a big decision. we help you make it a good one.
solar and battery technology is incredible, but sometimes the math doesn’t work out. we are the first company to give unbiased reports detailing how you can make sure you get a good deal.
we give you a second opinion you can trust because we have no skin in the game.
YOUR REPORT IS CUSTOM-MADE
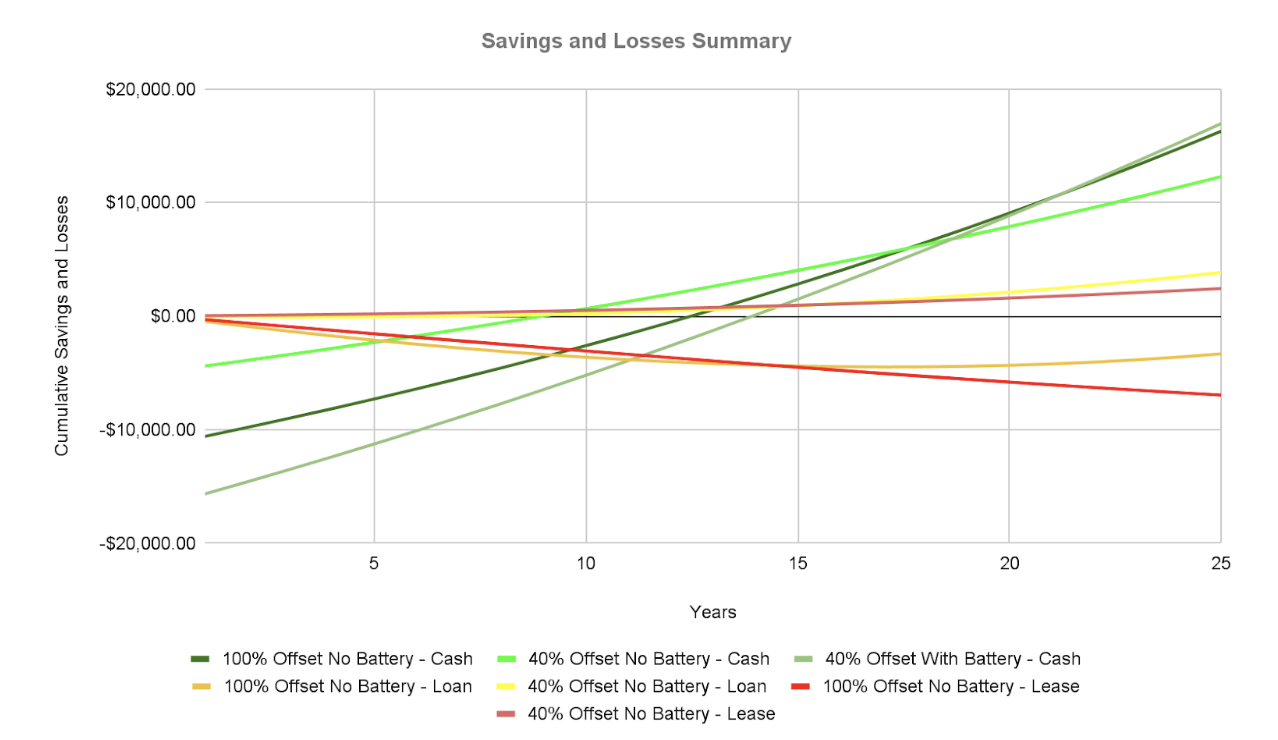
We use real data from your home to generate detailed models of the long-term financial performance of 6 different types of solar setups, each tested with 3 different forms of financing - cash, loan, and lease. That’s 18 total scenarios specific to your home.
nothing is a secret
We explain exactly how we calculated your results with a level of transparency that is often lacking from the solar industry. We can also decode quotes you already got so there are no surprises.
we don’t sell Solar (or your info)
We are completely independent. We get paid when you buy our reports and reviews. Unlike other quick solar estimate sites, we do not spam your inbox or sell your info to solar sales groups.
how many solar panels should you get?
should you get batteries?
how much do things cost in your area?
should you buy with cash, get a loan, or lease your system?
should you even be considering solar?
we can check your quotes
(or prepare you to do it yourself…)
are the savings estimates accurate?
are the production estimates accurate?
will the equipment do the things you want?
how do the financing terms work?
what does the fine print really mean?
we have the answers
we give you all the info you need without trying to sell you a system
what’s in the report?
What we recommend for you
Right up front, we tell you whether we think solar is a good investment or not depending on your motivations. We mention your best and worst case scenarios among the 18 that we model.
how you use and pay for energy
We explain how your energy provider charges you for electricity and how they compensate you for any excess electricity you generate. We also explain how your home uses energy and how that interacts with solar production.
What the results mean
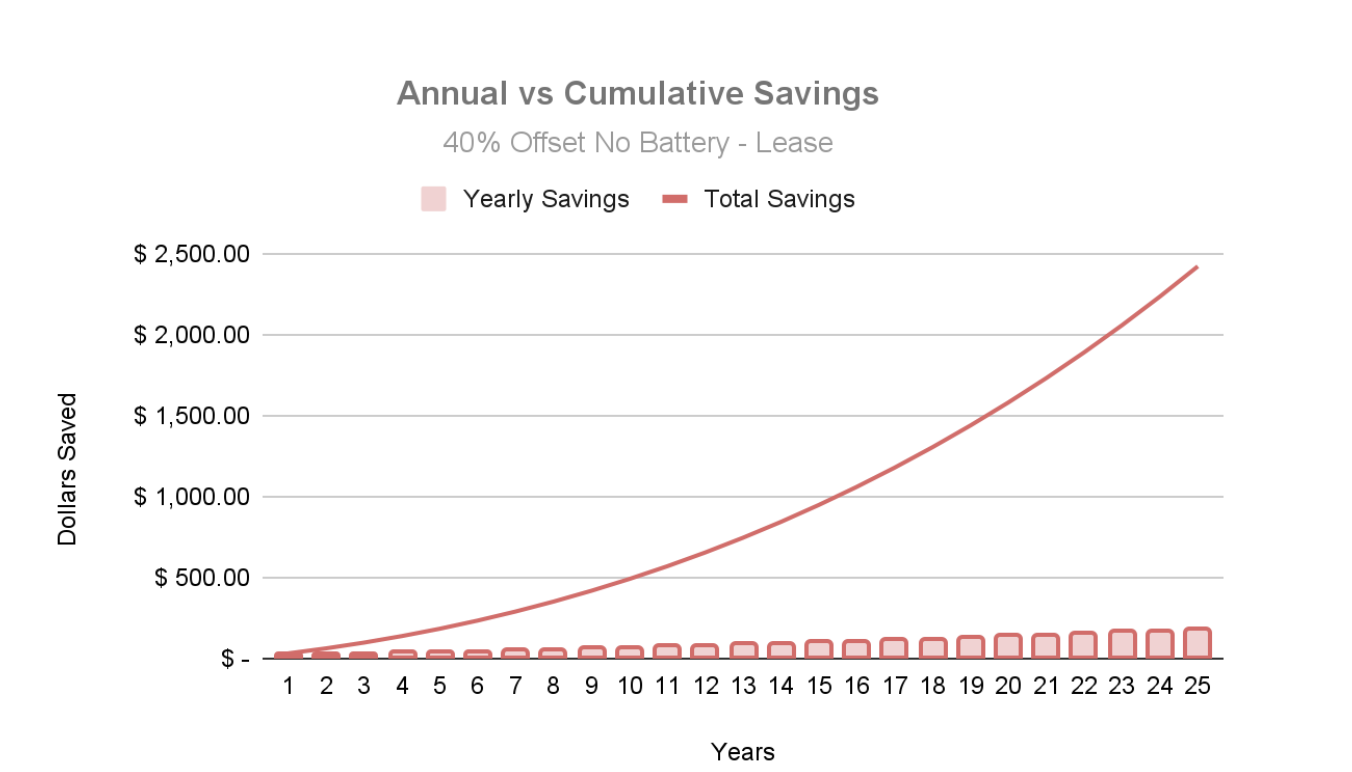
We explain in detail how to interpret each graph that we present and why we present the data the way we do. We also show, when relevant, how other investments perform compared to solar.
Assumptions and estimates
We explain, in detail, every assumption and estimate we make in order to generate your results and why we chose the ones we did. This way, you know how to spot bad assumptions, which are the basis for bad deals.
The important results
We show you the financial results over 25 years of your best case scenarios with cash purchase, loan, and lease options. We also show you the results of the most common industry offerings.
solar rebates and incentives
We tell you, definitively, whether there are any federal, state, or local rebates or incentives available for you to reduce the cost of a solar project.
It’s about 40 pages long, including charts and tables…
what’s in the quote review?
Your report
You get the entire report detailed above, and it serves as our basis for evaluating the quote(s) you need reviewed.
Truth analysis
We verify that the claims made about your equipment and how it will perform are true.
Financing analysis
If you are considering a loan or a lease, we help you understand exactly what the terms are and how you will be affected by them over time.
green or red flags
We call out any good or bad signs we notice in your quote and summarize our opinion.
Price analysis
We tell you how the pricing in your quote stacks up against industry averages in your area. savings proposal accuracy.
estimated savings assesment
We assess any claims about the likely savings from your system over time for accuracy and explain any assumptions that are being made.
Every quote review is accompanied by our full, custom report. We recommend reading the report first.
